Watersheds are the lifeblood of our ecosystems, and understanding their nitrogen cycles is revolutionizing how we approach environmental conservation and resource management today.
🌊 The Hidden World Beneath Our Feet: Understanding Watershed Dynamics
Every drop of water that falls from the sky begins a journey through an intricate network of streams, rivers, and underground channels. These pathways form watersheds—areas of land where all water drains to a common outlet. But watersheds are far more than simple drainage systems; they are complex biological factories where nutrients cycle, transform, and sustain life.
The nitrogen cycle within watersheds represents one of nature’s most critical processes. Nitrogen, an essential building block of life, moves through air, water, soil, and living organisms in a delicate dance that has maintained ecological balance for millennia. However, human activities have dramatically altered this balance, making nitrogen cycle mapping an urgent priority for environmental scientists and conservationists worldwide.
Understanding how nitrogen moves through watersheds provides invaluable insights into ecosystem health, water quality, agricultural sustainability, and climate change impacts. Recent advances in mapping technology and data analysis have finally unlocked secrets that were previously hidden beneath the surface, offering hope for more effective conservation strategies.
Why Nitrogen Matters More Than You Think
Nitrogen comprises approximately 78% of Earth’s atmosphere, yet most living organisms cannot use it in its atmospheric form. This paradox makes the nitrogen cycle absolutely essential for life. Specialized bacteria convert atmospheric nitrogen into forms that plants can absorb, which then moves up the food chain to animals and humans.
In watershed ecosystems, nitrogen plays multiple critical roles. It fuels plant growth, supports aquatic food webs, and influences water chemistry. When nitrogen levels are balanced, ecosystems thrive. When they become imbalanced—typically through excess—serious environmental problems emerge.
Excess nitrogen in watersheds leads to eutrophication, where nutrient overloading causes explosive algae growth. These algal blooms deplete oxygen in water, creating dead zones where fish and other aquatic life cannot survive. The Gulf of Mexico dead zone, covering thousands of square miles, stands as a stark reminder of what happens when watershed nitrogen cycles are disrupted.
The Agricultural Connection 🌾
Modern agriculture has fundamentally changed watershed nitrogen dynamics. Synthetic fertilizers have boosted food production dramatically, but they’ve also introduced unprecedented amounts of reactive nitrogen into natural systems. When farmers apply more nitrogen than crops can absorb, the excess washes into streams and rivers during rainfall events.
This agricultural runoff represents the largest source of nitrogen pollution in many watersheds. Understanding exactly where this nitrogen goes, how it transforms, and where it accumulates requires sophisticated mapping techniques that can track nitrogen through multiple pathways simultaneously.
Revolutionary Mapping Technologies Changing the Game
Traditional watershed monitoring relied on periodic water sampling at fixed locations—an approach that provided valuable but limited snapshots of nitrogen dynamics. Today’s nitrogen cycle mapping combines cutting-edge technologies to create comprehensive, dynamic models of how nitrogen moves through entire watershed systems.
Satellite remote sensing now allows scientists to monitor vegetation health, water quality indicators, and land use changes across vast areas. These orbital observations detect algal blooms, track seasonal patterns in plant nitrogen uptake, and identify pollution sources that would be invisible from ground level.
Geographic Information Systems (GIS) integrate multiple data layers—topography, soil types, precipitation patterns, land use, and direct measurements—into unified models. These powerful platforms reveal relationships and patterns that emerge only when diverse datasets are analyzed together.
Sensor Networks and Real-Time Monitoring 📡
Automated sensor networks deployed throughout watersheds now provide continuous, real-time nitrogen measurements. These sensors track nitrate levels, ammonium concentrations, and other nitrogen compounds 24/7, capturing variations that weekly or monthly sampling would miss entirely.
When heavy storms strike, for example, nitrogen concentrations can spike dramatically within hours as runoff carries nutrients from fields and urban areas into streams. Real-time monitoring captures these critical events, revealing exactly when and where nitrogen loads peak.
Machine learning algorithms analyze these continuous data streams to identify patterns, predict future conditions, and alert managers to potential problems before they become crises. This predictive capability represents a fundamental shift from reactive to proactive watershed management.
Mapping Reveals Critical Nitrogen Hotspots
One of the most valuable insights from advanced nitrogen mapping is the identification of hotspots—specific locations where nitrogen transformation or accumulation occurs at unusually high rates. These hotspots often occupy relatively small areas but exert disproportionate influence on watershed nitrogen dynamics.
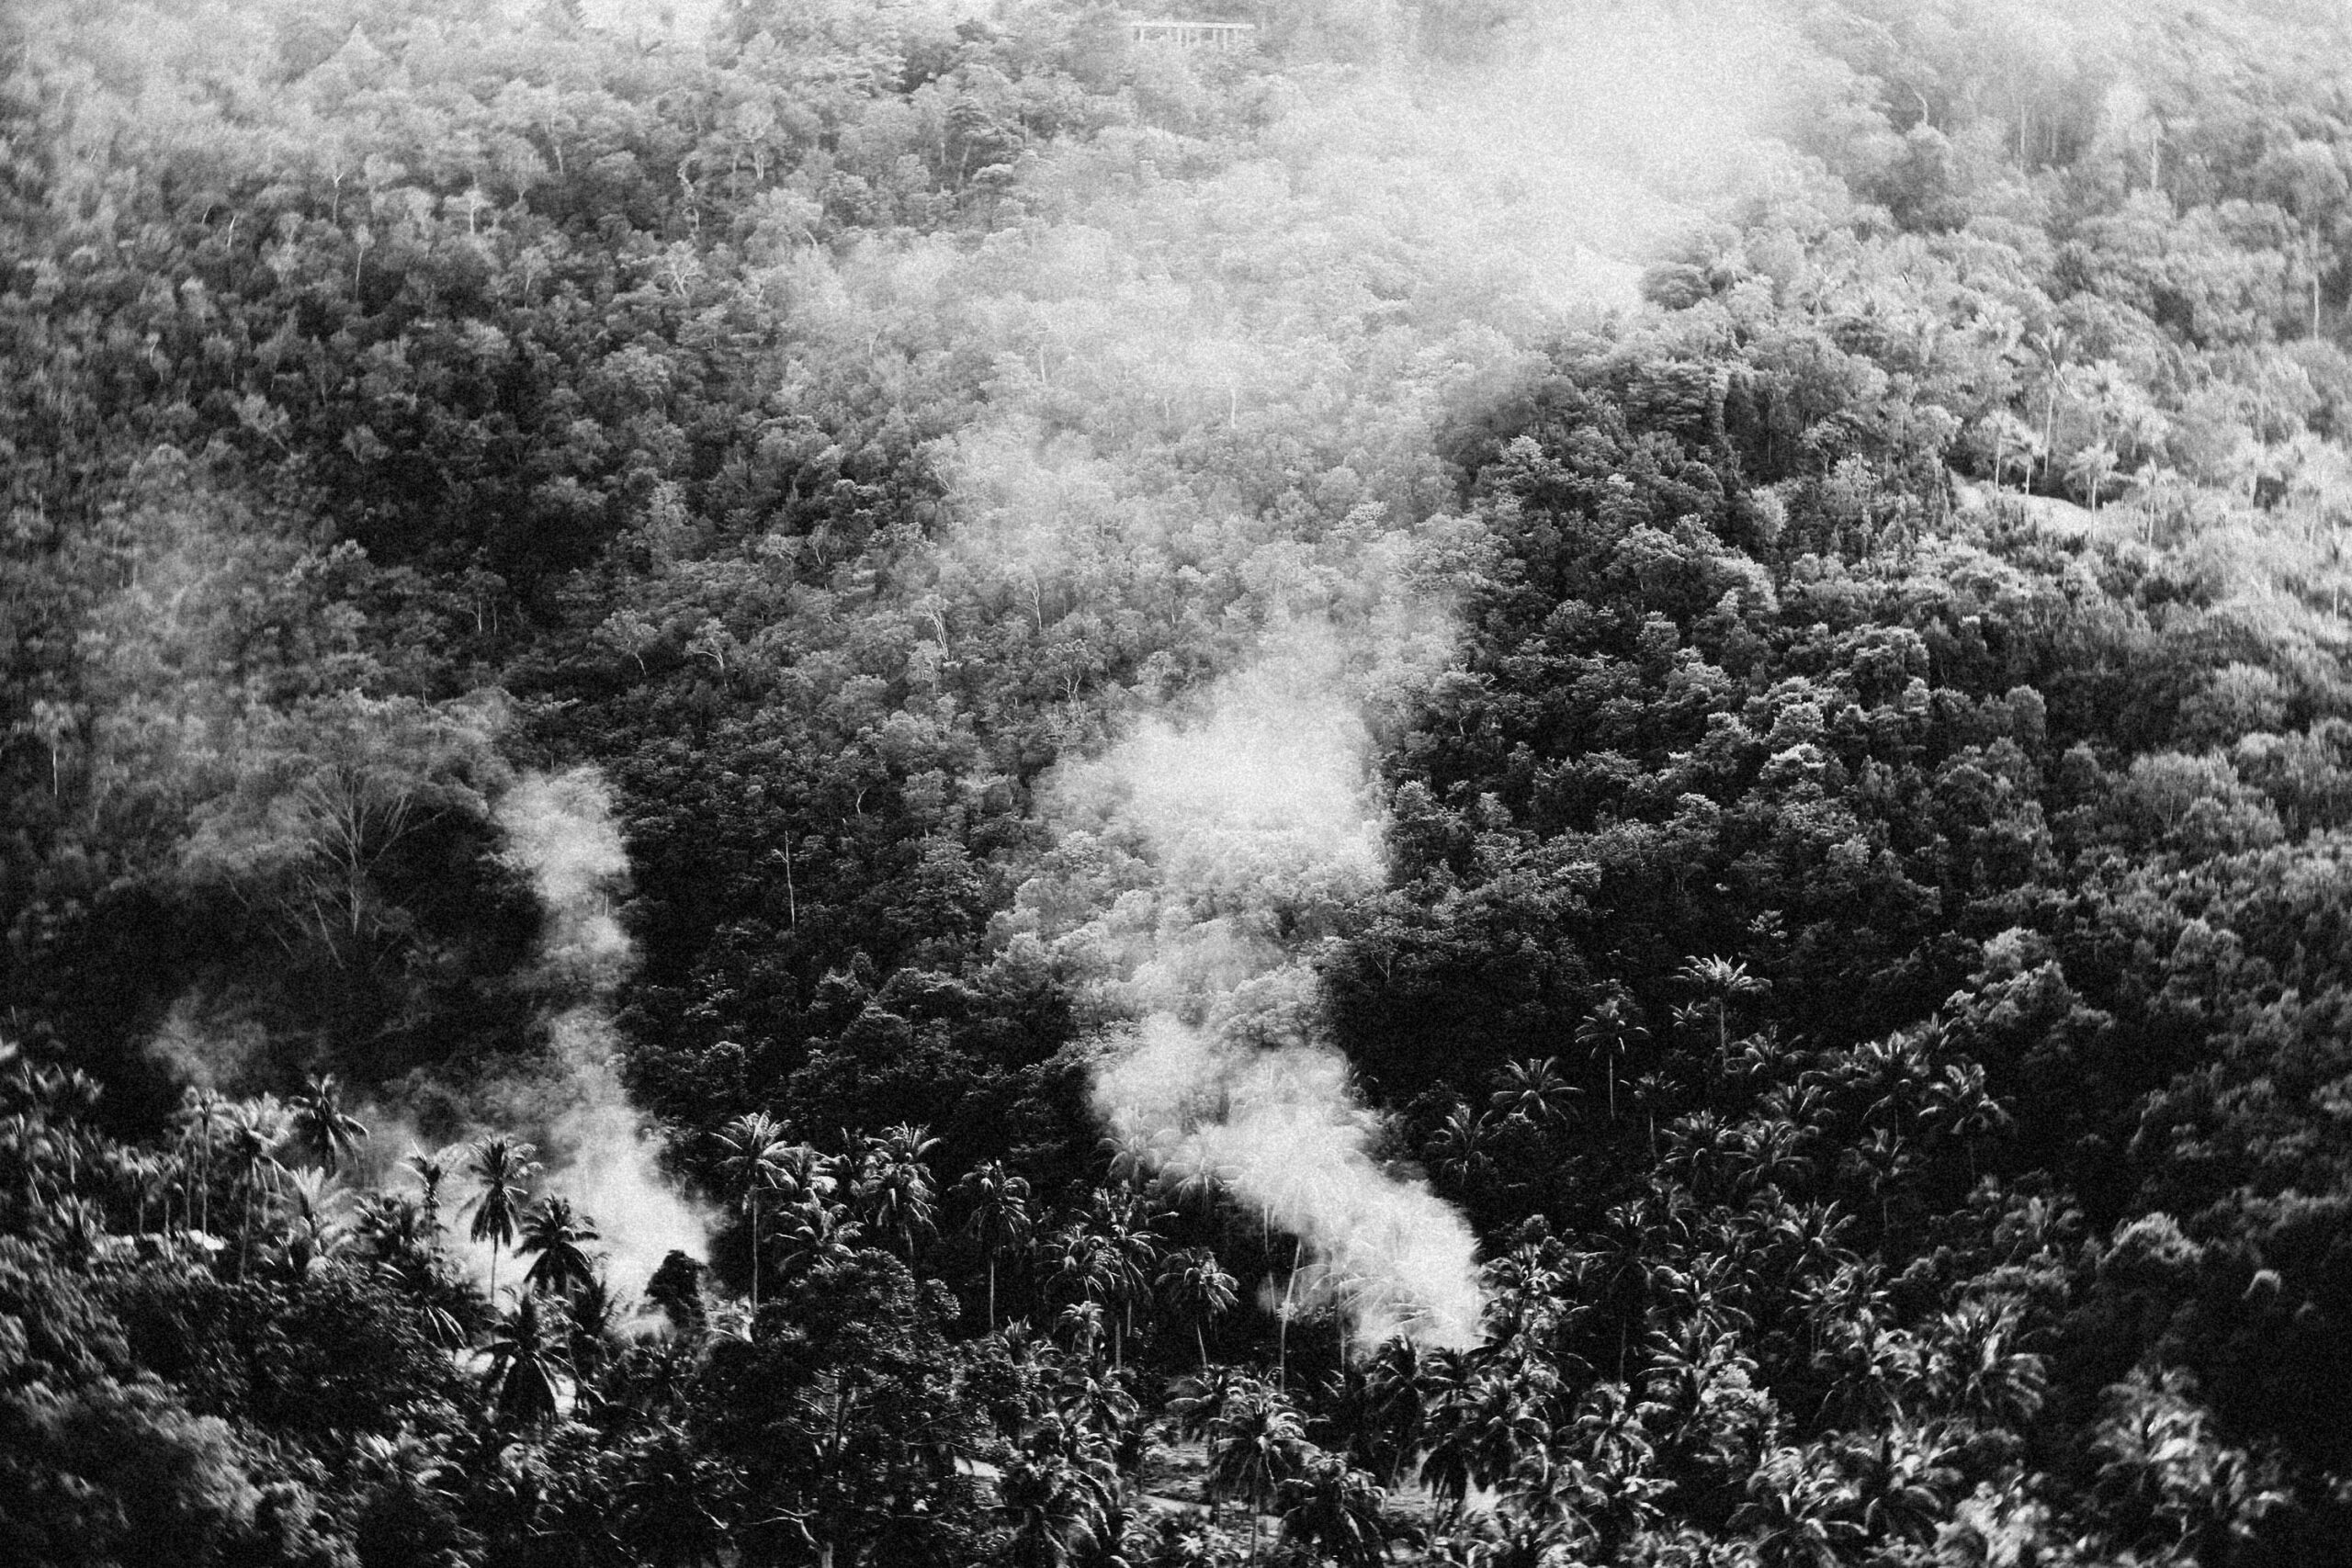
Riparian zones—the strips of land bordering streams and rivers—frequently emerge as critical nitrogen processing areas. Vegetation and soil microbes in these transition zones intercept nitrogen moving from upland areas toward water bodies, converting much of it back into atmospheric nitrogen through denitrification.
Wetlands function as natural nitrogen filters, removing substantial quantities before they reach downstream waters. Mapping has quantified just how valuable these ecosystems are, providing concrete justification for wetland protection and restoration as cost-effective nitrogen management strategies.
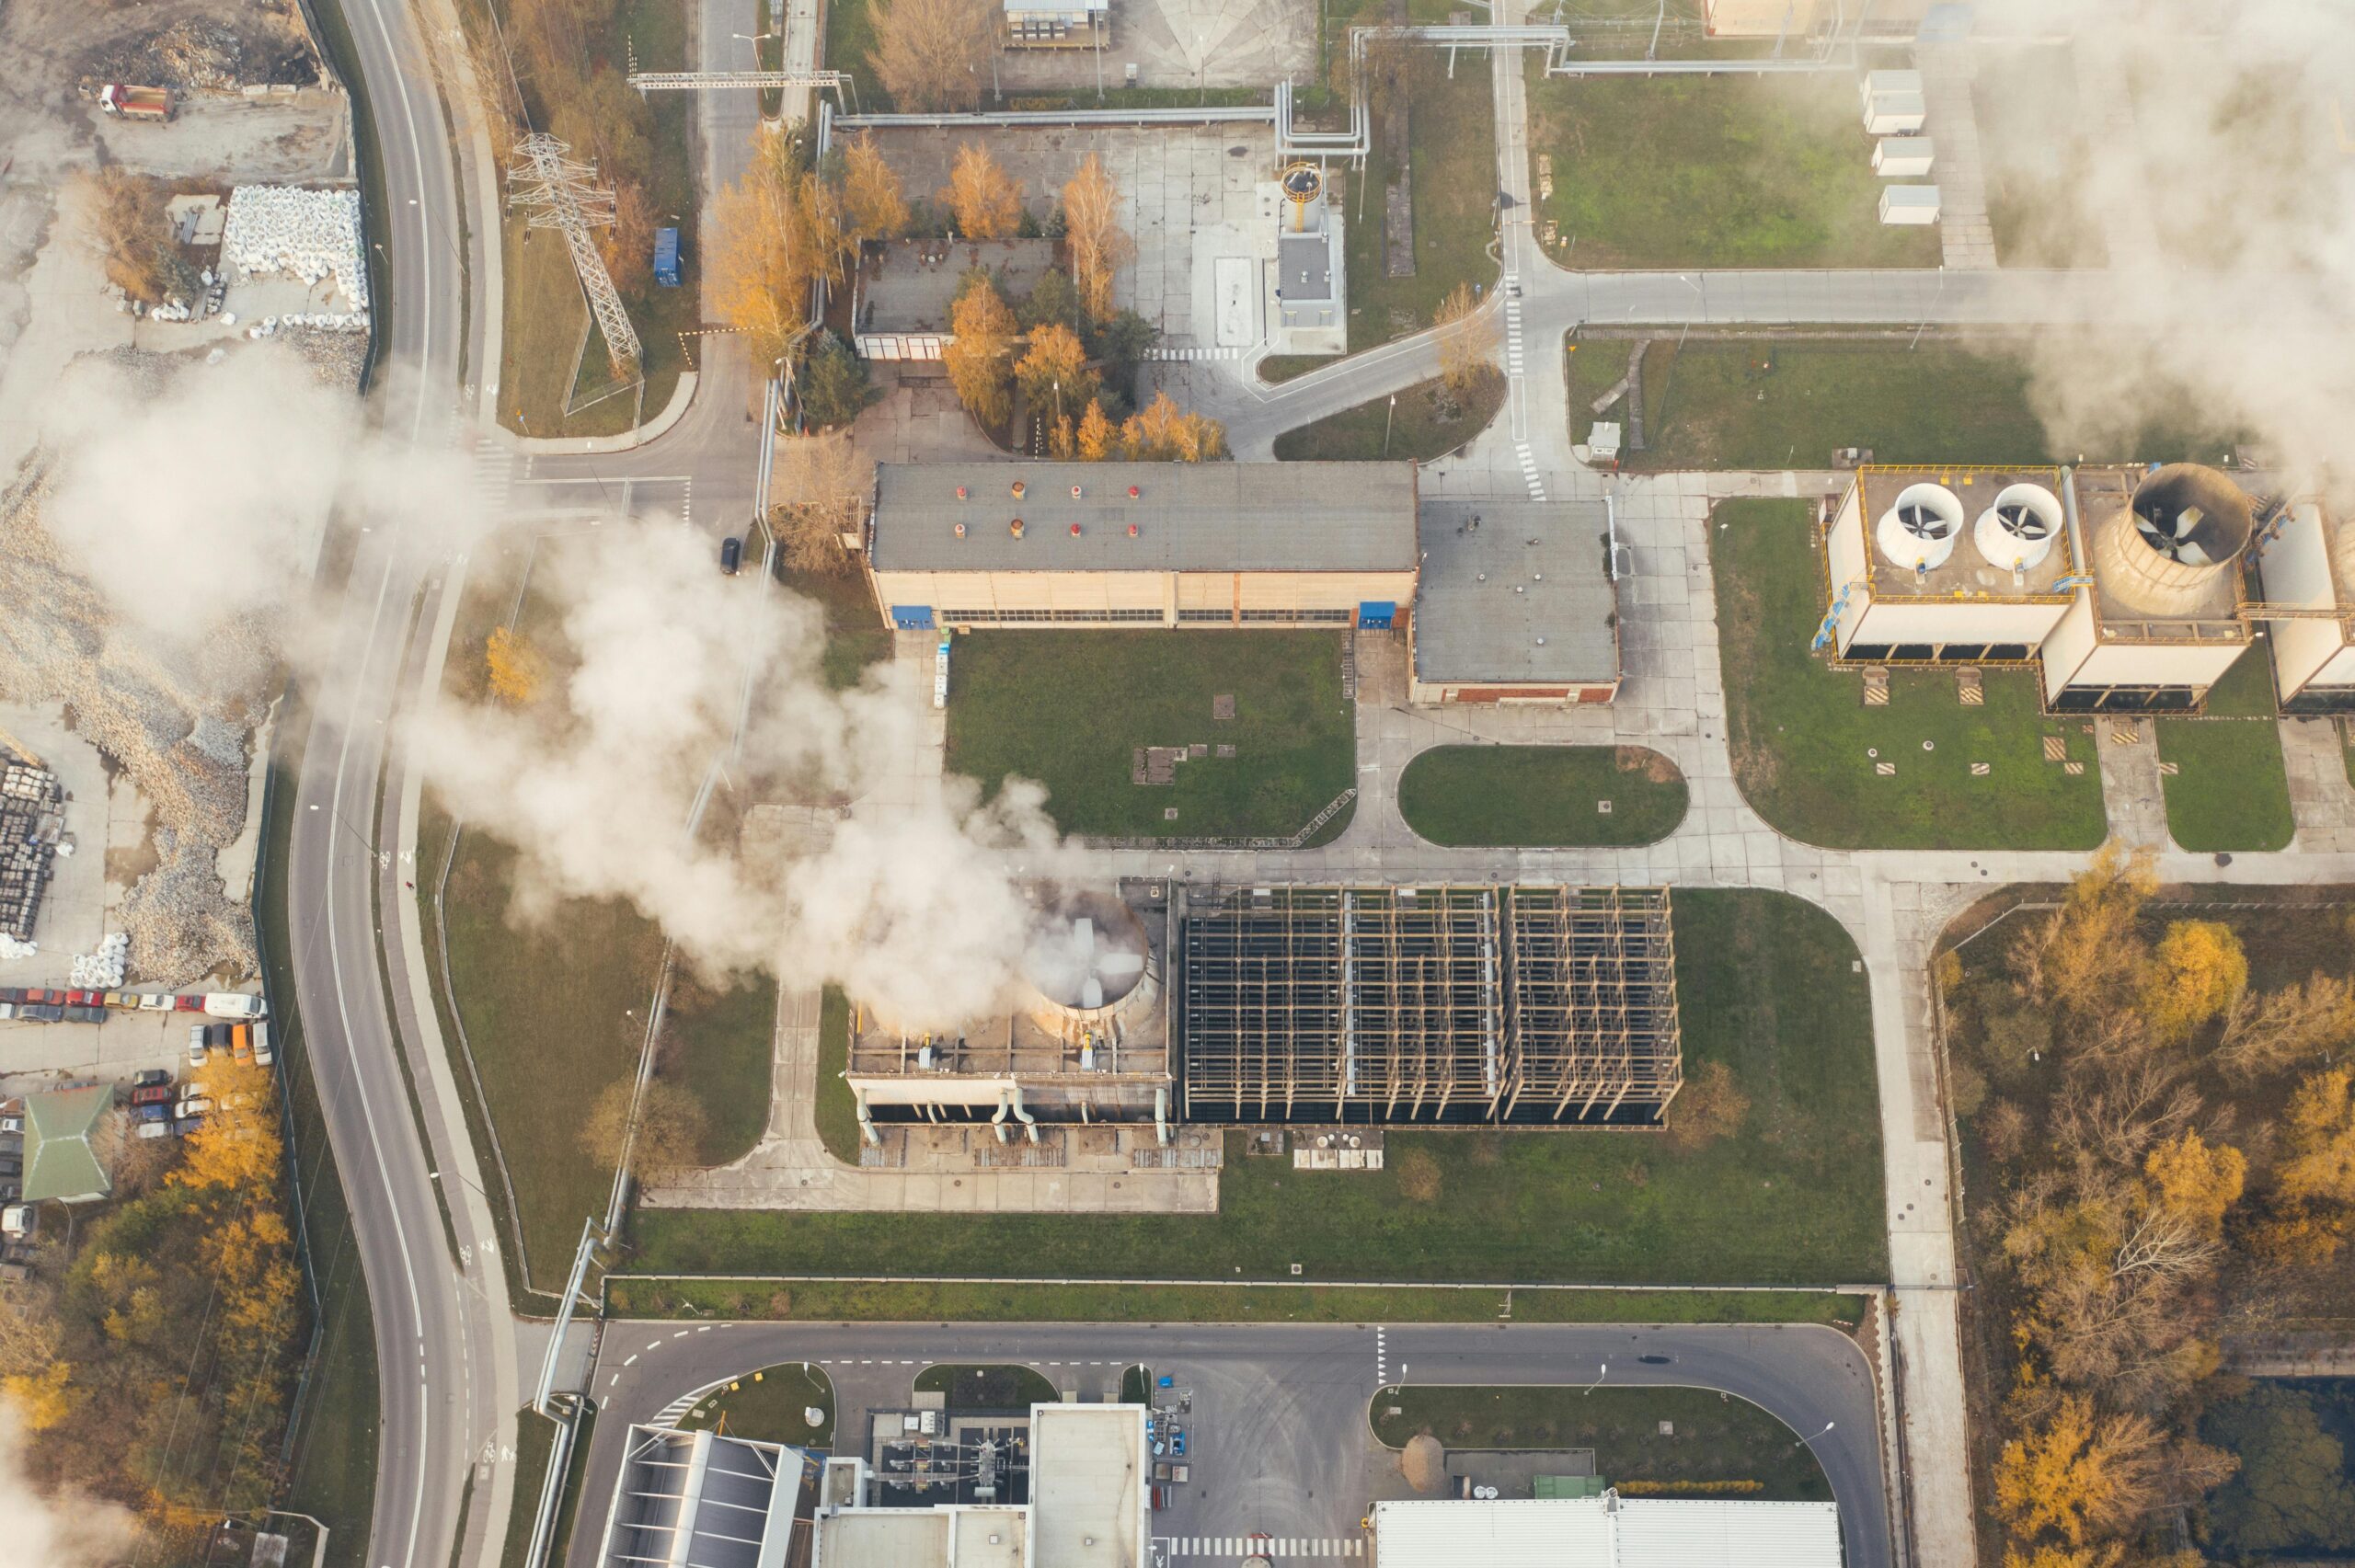
Urban Contributions Often Underestimated 🏙️
While agriculture typically dominates watershed nitrogen budgets, detailed mapping has revealed that urban areas contribute more than previously recognized. Lawn fertilizers, pet waste, leaking septic systems, and stormwater runoff all add significant nitrogen loads.
Urban nitrogen sources are particularly problematic because they’re dispersed and difficult to control. Mapping these diffuse sources helps cities target interventions where they’ll have the greatest impact, such as green infrastructure that captures and treats stormwater before it enters streams.
Seasonal Patterns and Climate Connections
Nitrogen cycle mapping has revealed distinct seasonal patterns that vary significantly by region and watershed characteristics. In temperate zones, spring typically brings peak nitrogen exports as melting snow and spring rains mobilize nitrogen that accumulated over winter.
Summer patterns depend heavily on vegetation activity. Growing crops and forests actively absorb nitrogen, temporarily reducing concentrations in water. However, intense summer storms can trigger sudden nitrogen pulses that overwhelm natural processing capacity.
Fall brings another critical period as crop harvests leave fields bare and vulnerable to nitrogen loss. Autumn rains then flush accumulated nitrogen into waterways just when aquatic ecosystems are least able to process the additional nutrient load.
Climate Change Amplifies Nitrogen Challenges 🌡️
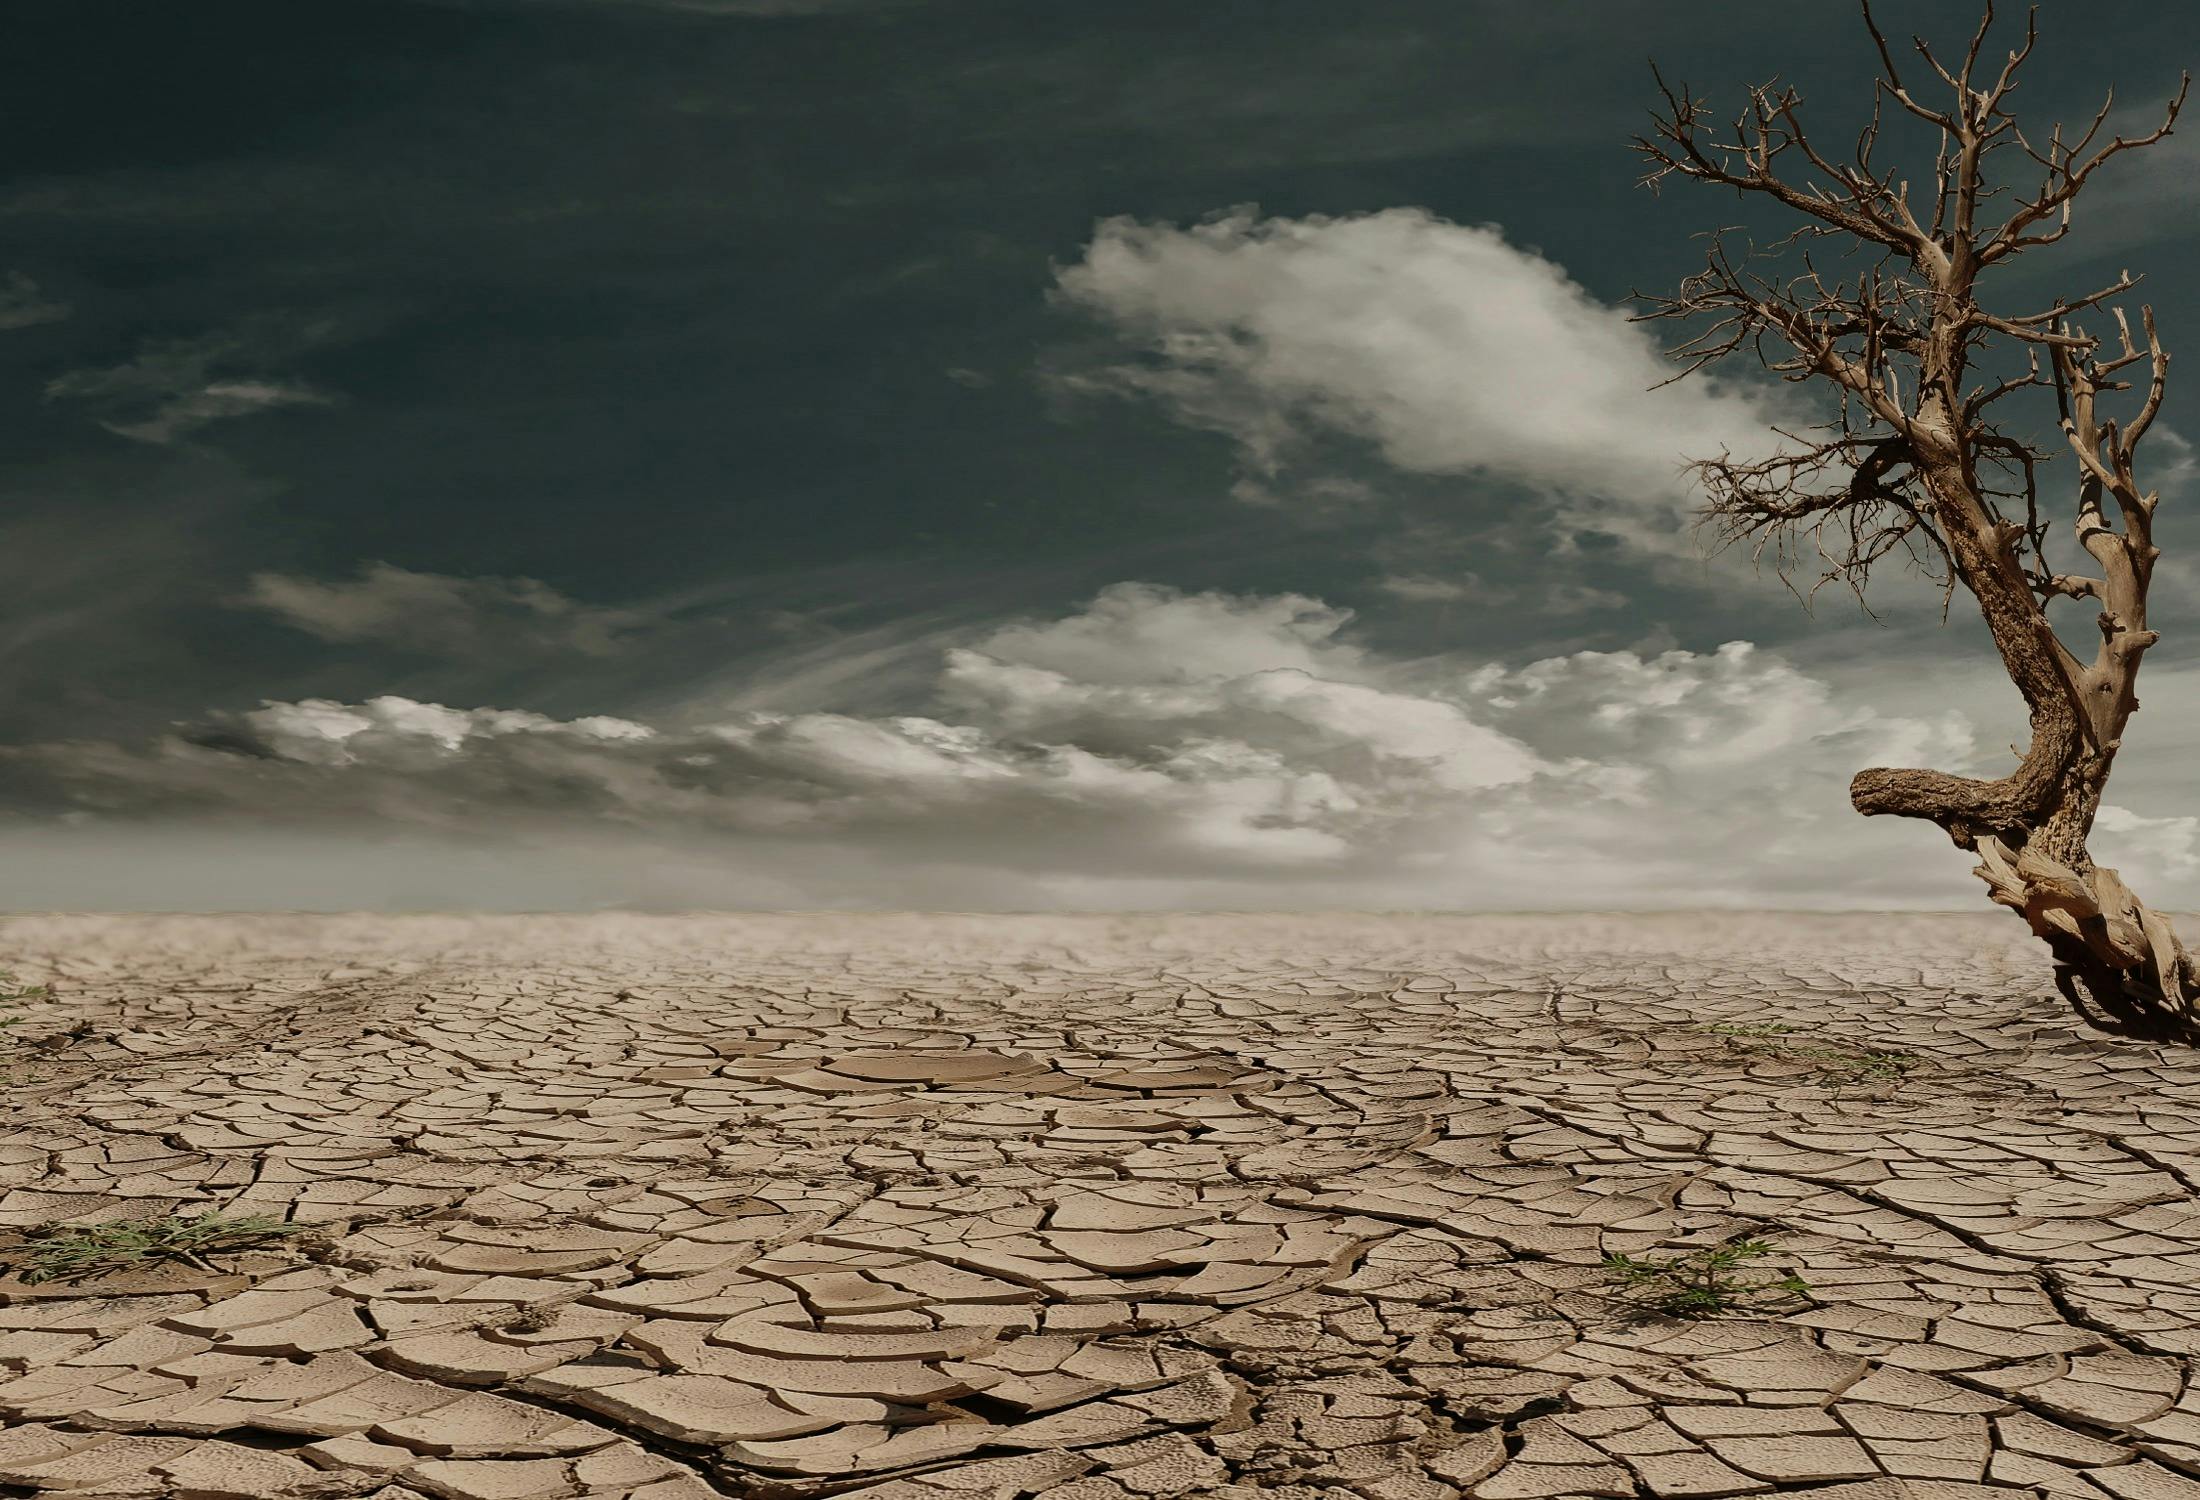
Long-term nitrogen mapping datasets are revealing worrying trends related to climate change. More intense precipitation events—now occurring more frequently in many regions—create larger nitrogen pulses that exceed watershed processing capacity. Extended droughts concentrate nitrogen in reduced water volumes, then massive storms flush these accumulated nutrients in overwhelming surges.
Rising temperatures accelerate some nitrogen cycle processes while slowing others, disrupting the balanced timing that natural systems depend on. Warming waters hold less dissolved oxygen, making them more vulnerable to oxygen depletion when nitrogen-fueled algal blooms decay.
From Data to Action: Conservation Applications
The true value of nitrogen cycle mapping lies in its application to practical conservation and management decisions. Armed with detailed understanding of nitrogen pathways and hotspots, resource managers can design targeted interventions that achieve maximum impact with limited resources.
Precision agriculture uses nitrogen mapping at the field scale to match fertilizer applications precisely to crop needs, reducing excess that would otherwise wash away. Variable rate technology applies different fertilizer amounts to different parts of fields based on soil conditions, topography, and crop requirements mapped in detail.
Strategic conservation programs use watershed-scale nitrogen mapping to prioritize where land protection, easements, or restoration projects will most effectively reduce nitrogen pollution. Protecting or restoring a wetland in a critical location might remove more nitrogen than dozens of projects in less strategic locations.
Success Stories Demonstrating Real Impact 🎯
The Chesapeake Bay watershed nitrogen reduction program exemplifies how mapping-informed strategies can achieve measurable results. By identifying priority areas and tracking progress through continuous monitoring, the multi-state effort has documented steady nitrogen load reductions even as the regional population grew.
In New Zealand, nitrogen mapping has guided dairy farm management reforms that significantly reduced nutrient runoff while maintaining productivity. Detailed understanding of how nitrogen moves through specific farm landscapes enabled targeted interventions rather than one-size-fits-all regulations.
European Union countries have used nitrogen mapping to implement the Water Framework Directive, establishing watershed-specific targets based on actual nitrogen processing capacity rather than arbitrary standards. This science-based approach has improved both environmental outcomes and stakeholder acceptance.
Emerging Innovations on the Horizon
Nitrogen cycle mapping continues to evolve rapidly as new technologies and approaches emerge. Environmental DNA (eDNA) analysis now allows scientists to map the distribution and activity of nitrogen-cycling bacteria throughout watersheds, revealing the microscopic engines driving nitrogen transformations.
Drone technology equipped with specialized sensors provides ultra-high-resolution mapping of field conditions, vegetation health, and water quality indicators. These aerial platforms bridge the gap between satellite observations and ground measurements, capturing critical details at landscape scales.
Isotope tracking techniques distinguish nitrogen from different sources—synthetic fertilizer versus manure versus atmospheric deposition—allowing precise source attribution. This capability helps identify which nitrogen reduction strategies will be most effective in specific watersheds.
Citizen Science Expands Monitoring Networks 👥
Engaging community members in watershed monitoring dramatically expands data collection capacity. Trained volunteers collect water samples, report observations, and operate simple test kits that contribute valuable data to mapping efforts. This participation also builds public understanding and support for conservation actions.
Mobile apps now make citizen science contributions easier and more standardized. Participants photograph stream conditions, record GPS coordinates automatically, and submit observations that instantly integrate into mapping databases. This crowdsourced data complements professional monitoring, filling spatial and temporal gaps that would otherwise remain unmonitored.
Integrated Management for Watershed Health
Effective watershed management requires integrating nitrogen considerations with other environmental priorities. Nitrogen cycle mapping increasingly connects with sediment tracking, carbon monitoring, habitat assessment, and water quantity management to support holistic watershed planning.
This integrated approach recognizes that interventions for one problem often affect others. Riparian buffers that filter nitrogen also reduce sediment pollution, provide wildlife habitat, and stabilize stream banks. Understanding these multiple benefits through comprehensive mapping helps justify investments and maximize returns.
Collaborative governance structures bring together diverse stakeholders—farmers, municipalities, industries, conservation organizations, and regulatory agencies—to develop shared watershed management plans informed by mapping data. This cooperation is essential because watersheds rarely respect political boundaries.

Building Resilient Watersheds for Future Generations
As we unlock more secrets through advanced nitrogen cycle mapping, the path toward healthier watersheds becomes clearer. The insights gained reveal both challenges and opportunities, highlighting where problems are most severe while also identifying solutions that work.
Investing in nitrogen mapping capacity pays long-term dividends. Better data enables smarter decisions, reducing waste and improving outcomes. The economic benefits of avoided water treatment costs, protected fisheries, and sustained ecosystem services far exceed the costs of comprehensive monitoring and mapping programs.
Education and outreach that translate mapping insights into accessible information help everyone understand their connection to watershed health. When people see how their actions affect nitrogen cycles and water quality, they’re more likely to support and participate in conservation efforts.
The future of watershed conservation depends on continuing to refine our understanding of nitrogen dynamics while applying current knowledge to on-the-ground improvements. Every watershed has unique characteristics, requiring locally tailored approaches informed by detailed mapping of its specific nitrogen cycle patterns.
By combining cutting-edge technology with traditional ecological knowledge, engaging diverse stakeholders, and maintaining long-term monitoring commitments, we can restore balance to watershed nitrogen cycles. This work isn’t just about environmental protection—it’s about securing clean water, productive lands, and healthy ecosystems for generations to come. The secrets revealed through nitrogen cycle mapping provide both the knowledge and the motivation to act decisively in protecting these vital natural systems. 💧